Monitoring InfiniBand Fabrics
This document aims to cover strategies for monitoring InfiniBand fabrics.
Discovery
Before we start monitoring InfiniBand traffic on a host, we need to first understand the hardware configuration.
Things we are interested in:
-
How many Host Channel Adapters (HCA) are there on the host?
-
How many ports does each HCA have?
-
What are the Local IDs (LIDs) of each HCA?
To view this information in a concise, human-readable format, run ibstat on the host as root. You should get output similar to the following:
root@o186i221:~# ibstat
CA 'mlx5_0'
	CA type: MT4123
	Number of ports: 1
	Firmware version: 20.33.1048
	Hardware version: 0
	Node GUID: 0x88e9a4ffff317104
	System image GUID: 0x88e9a4ffff317104
	Port 1:
		State: Active
		Physical state: LinkUp
		Rate: 200
		Base lid: 152
		LMC: 0
		SM lid: 30
		Capability mask: 0xa651e848
		Port GUID: 0x88e9a4ffff317104
		Link layer: InfiniBand
CA 'mlx5_1'
	CA type: MT4123
	Number of ports: 1
	Firmware version: 20.33.1048
	Hardware version: 0
	Node GUID: 0x88e9a4ffff3161a8
	System image GUID: 0x88e9a4ffff3161a8
	Port 1:
		State: Active
		Physical state: LinkUp
		Rate: 200
		Base lid: 147
		LMC: 0
		SM lid: 30
		Capability mask: 0xa651e848
		Port GUID: 0x88e9a4ffff3161a8
		Link layer: InfiniBand
CA 'mlx5_2'
	CA type: MT4123
	Number of ports: 1
	Firmware version: 20.33.1048
	Hardware version: 0
	Node GUID: 0x88e9a4ffff31714c
	System image GUID: 0x88e9a4ffff31714c
	Port 1:
		State: Active
		Physical state: LinkUp
		Rate: 200
		Base lid: 154
		LMC: 0
		SM lid: 30
		Capability mask: 0xa651e848
		Port GUID: 0x88e9a4ffff31714c
		Link layer: InfiniBand
CA 'mlx5_3'
	CA type: MT4119
	Number of ports: 1
	Firmware version: 16.33.1048
	Hardware version: 0
	Node GUID: 0x88e9a4ffff4299a4
	System image GUID: 0x88e9a4ffff4299a4
	Port 1:
		State: Active
		Physical state: LinkUp
		Rate: 100
		Base lid: 0
		LMC: 0
		SM lid: 0
		Capability mask: 0x00010000
		Port GUID: 0x8ae9a4fffe4299a4
		Link layer: Ethernet
CA 'mlx5_4'
	CA type: MT4123
	Number of ports: 1
	Firmware version: 20.33.1048
	Hardware version: 0
	Node GUID: 0x88e9a4ffff317168
	System image GUID: 0x88e9a4ffff317168
	Port 1:
		State: Active
		Physical state: LinkUp
		Rate: 200
		Base lid: 155
		LMC: 0
		SM lid: 30
		Capability mask: 0xa651e848
		Port GUID: 0x88e9a4ffff317168
		Link layer: InfiniBand
In this example, our system has 5 single-port ConnectX-6 HCAs, with the following LIDs:
-
mlx5_0: 152 -
mlx5_1: 147 -
mlx5_2: 154 -
mlx5_3: 0 -
mlx5_4: 155
If everything has configured correctly when MOFED was installed,
then you should see the cards also appearing under /sys/class/infiniband:
root@o186i221:~# ls -l /sys/class/infiniband
total 0
lrwxrwxrwx 1 root root 0 Sep  6 13:17 mlx5_0 -> ../../devices/pci0000:00/0000:00:01.1/0000:03:00.0/0000:04:04.0/0000:0e:00.0/infiniband/mlx5_0
lrwxrwxrwx 1 root root 0 Sep  6 13:17 mlx5_1 -> ../../devices/pci0000:40/0000:40:01.1/0000:43:00.0/0000:44:00.0/0000:45:00.0/infiniband/mlx5_1
lrwxrwxrwx 1 root root 0 Sep  6 13:17 mlx5_2 -> ../../devices/pci0000:80/0000:80:01.1/0000:83:00.0/0000:84:00.0/0000:85:00.0/infiniband/mlx5_2
lrwxrwxrwx 1 root root 0 Sep  6 13:17 mlx5_3 -> ../../devices/pci0000:a0/0000:a0:03.1/0000:a3:00.0/0000:a4:02.0/0000:b0:00.0/infiniband/mlx5_3
lrwxrwxrwx 1 root root 0 Sep  6 13:17 mlx5_4 -> ../../devices/pci0000:c0/0000:c0:01.1/0000:c3:00.0/0000:c4:00.0/0000:c5:00.0/infiniband/mlx5_4
Underneath the device’s directory, you can find counter files to track real-time statistics about each port. For example:
/sys/class/infiniband/mlx5_0/ports/1/counters
├── excessive_buffer_overrun_errors
├── link_downed
├── link_error_recovery
├── local_link_integrity_errors
├── multicast_rcv_packets
├── multicast_xmit_packets
├── port_rcv_constraint_errors
├── port_rcv_data
├── port_rcv_errors
├── port_rcv_packets
├── port_rcv_remote_physical_errors
├── port_rcv_switch_relay_errors
├── port_xmit_constraint_errors
├── port_xmit_data
├── port_xmit_discards
├── port_xmit_packets
├── port_xmit_wait
├── symbol_error
├── unicast_rcv_packets
├── unicast_xmit_packets
└── VL15_dropped
Cracking open one of these files reveals a port counter value:
root@o186i221:~/# cat /sys/class/infiniband/mlx5_0/ports/1/counters/port_rcv_packets
280929405
Port Counters Description
| Counter | Description | InfiniBand Spec Name |
|---|---|---|
port_rcv_data |
The total number of data octets, divided by 4, (counting in double words, 32 bits), received on all VLs from the port. |
PortRcvData |
port_rcv_packets |
Total number of packets (this may include packets containing Errors. This is 64 bit counter. |
PortRcvPkts |
port_xmit_data |
The total number of data octets, divided by 4, (counting in double words, 32 bits), transmitted on all VLs from the port. |
PortXmitData |
port_xmit_packets |
Total number of packets transmitted on all VLs from this port. This may include packets with errors. |
PortXmitPkts |
port_xmit_wait |
The number of ticks during which the port had data to transmit but no data was sent during the entire tick (either because of insufficient credits or because of lack of arbitration). |
PortXmitWait |
Monitoring Counters
As time goes on, these counters will be added to as packets are received or transmitted on the HCA port. We could write a tool to read these counters over time, but fortunately there are already tools out there that do reading, aggregation, and resetting of these counters into a nice format.
Perfquery
One of the tools, perfquery comes with the infiniband-diags package which gets installed when you install the rdma-core module.
This allows you to query port counters and reset them after reading, making interval-based queries much easier.
Perfquery Usage
Usage: perfquery [options]  [<lid|guid> [[port(s)] [reset_mask]]]

Options:
  --extended, -x          show extended port counters
  --xmtsl, -X             show Xmt SL port counters
  --rcvsl, -S             show Rcv SL port counters
  --xmtdisc, -D           show Xmt Discard Details
  --rcverr, -E            show Rcv Error Details
  --extended_speeds, -T   show port extended speeds counters
  --oprcvcounters         show Rcv Counters per Op code
  --flowctlcounters       show flow control counters
  --vloppackets           show packets received per Op code per VL
  --vlopdata              show data received per Op code per VL
  --vlxmitflowctlerrors   show flow control update errors per VL
  --vlxmitcounters        show ticks waiting to transmit counters per VL
  --swportvlcong          show sw port VL congestion
  --rcvcc                 show Rcv congestion control counters
  --slrcvfecn             show SL Rcv FECN counters
  --slrcvbecn             show SL Rcv BECN counters
  --xmitcc                show Xmit congestion control counters
  --vlxmittimecc          show VL Xmit Time congestion control counters
  --smplctl, -c           show samples control
  --all_ports, -a         show aggregated counters
  --loop_ports, -l        iterate through each port
  --reset_after_read, -r  reset counters after read
  --Reset_only, -R        only reset counters
  --config, -z <config>   use config file, default: /etc/infiniband-diags/ibdiag.conf
  --Ca, -C <ca>           Ca name to use
  --Port, -P <port>       Ca port number to use
  --Lid, -L               use LID address argument
  --Guid, -G              use GUID address argument
  --timeout, -t <ms>      timeout in ms
  --sm_port, -s <lid>     SM port lid
  --m_key, -y <key>       M_Key to use in request
  --errors, -e            show send and receive errors
  --verbose, -v           increase verbosity level
  --debug, -d             raise debug level
  --help, -h              help message
  --version, -V           show version

Examples:
  perfquery 		# read local port's performance counters
  perfquery 32 1		# read performance counters from lid 32, port 1
  perfquery -x 32 1	# read extended performance counters from lid 32, port 1
  perfquery -a 32		# read performance counters from lid 32, all ports
  perfquery -r 32 1	# read performance counters and reset
  perfquery -x -r 32 1	# read extended performance counters and reset
  perfquery -R 0x20 1	# reset performance counters of port 1 only
  perfquery -x -R 0x20 1	# reset extended performance counters of port 1 only
  perfquery -R -a 32	# reset performance counters of all ports
  perfquery -R 32 2 0x0fff	# reset only error counters of port 2
  perfquery -R 32 2 0xf000	# reset only non-error counters of port 2
  perfquery -a 32 1-10	# read performance counters from lid 32, port 1-10, aggregate output
  perfquery -l 32 1-10	# read performance counters from lid 32, port 1-10, output each port
  perfquery -a 32 1,4,8	# read performance counters from lid 32, port 1, 4, and 8, aggregate output
  perfquery -l 32 1,4,8	# read performance counters from lid 32, port 1, 4, and 8, output each port
Just executing perfquery by itself will return counter results for the first HCA device/port it finds on the host.
This isn’t super helpful if we have multiple cards. Instead, we’ll want to specify a LID and port:
perfquery <device_lid> <device_port>Example:
root@o186i221:~# perfquery 155 1
# Port counters: Lid 155 port 1 (CapMask: 0x5A00)
PortSelect:......................1
CounterSelect:...................0x0000
SymbolErrorCounter:..............0
LinkErrorRecoveryCounter:........0
LinkDownedCounter:...............0
PortRcvErrors:...................0
PortRcvRemotePhysicalErrors:.....0
PortRcvSwitchRelayErrors:........0
PortXmitDiscards:................0
PortXmitConstraintErrors:........0
PortRcvConstraintErrors:.........0
CounterSelect2:..................0x00
LocalLinkIntegrityErrors:........0
ExcessiveBufferOverrunErrors:....0
QP1Dropped:......................0
VL15Dropped:.....................0
PortXmitData:....................282509
PortRcvData:.....................350990
PortXmitPkts:....................4225
PortRcvPkts:.....................5420
PortXmitWait:....................0
A more powerful usage is to perform a --reset_after_read, to reset the counters back to 0 after we’ve read them.
This lets us run perfquery on an interval-based loop, resetting after each read, getting statistics for the last interval. In this example we read the counters every second, filtering the results by just the received and transmitted packets and data.
watch -n 1 'perfquery -r 152 1 | grep -P "Port(Xmit|Rcv)(Data|Pkts)"'
Example:
Every 1.0s: perfquery -r 152 1 | grep -P "Port...  o186i221: Thu Sep  7 20:26:06 2023

PortXmitData:....................1008
PortRcvData:.....................1452
PortXmitPkts:....................14
PortRcvPkts:.....................20
This is great for monitoring immediate activity on a single card, but on its own doesn’t track activity across multiple cards or aggregate information. Hence why I’ve built the following tool, IBmon, to use this under the hood and capture information to CSV files in a more post-processing-friendly way.
IBmon
Clone the omniscient repository so you can use the ibmon.sh and aggregate.py scripts:
git clone https://github.com/inf0rmatiker/omniscient
cd omniscient/monitoring/ibmon/
This collects interval-based snapshots of the port counters into a concise CSV file that you can load using a Pandas DataFrame, then graph using Matplotlib.
IBmon Usage
To run the ibmon.sh script you’ll need to provide it with a few pieces of information as positional arguments:
ibmon.sh <output_dir> <monitor_id> <snapshot_seconds> <total_snapshots> <ib_devices> <device_port>-
output_dir: The directory you want the snapshot results to go to. -
monitor_id: The unique ID of the monitor session. This could be either a number, date string, or UUID — really whatever you want. -
snapshot_seconds: The interval between snapshots in seconds. Default is usually1. -
total_snapshots: The total amount of snapshots you wish to take before exiting. -
ib_devices: A comma-separated string of mlx5 device names you wish to monitor. -
device_port: The port ID on each device you wish to monitor. Only 1 port is supported for monitoring currently. Default is1for the first port.
Example:
# ./ibmon.sh /tmp/omniscient/ root-20230911-200447 1 5 "mlx5_0,mlx5_1,mlx5_2,mlx5_4" 1
Port LID for mlx5_0, port 1: 152
Port LID for mlx5_1, port 1: 147
Port LID for mlx5_2, port 1: 154
Port LID for mlx5_4, port 1: 155
Resulting output files:
# tree /tmp/omniscient/
/tmp/omniscient/
├── o186i221_1694189342.ibmon.pid
├── o186i221_mlx5_0_152_root-20230911-200447.ibmon.csv
├── o186i221_mlx5_1_147_root-20230911-200447.ibmon.csv
├── o186i221_mlx5_2_154_root-20230911-200447.ibmon.csv
└── o186i221_mlx5_4_155_root-20230911-200447.ibmon.csv

0 directories, 5 files
Then you can use aggregate.py to aggregate the CSV results:
python3 aggregate.py example/ root-20230911-200447This outputs two files:
-
example/o186i221_root-20230911-200447_host_aggregate.ibmon.csv: This is a file that’s aggregated all the device captures to a single file for a given host. -
example/root-20230911-200447_total_aggregate.ibmon.csv: This is a file that’s aggregated all the host (and underlying device) captures to a single file for a given monitor, which may span multiple nodes in the cluster.
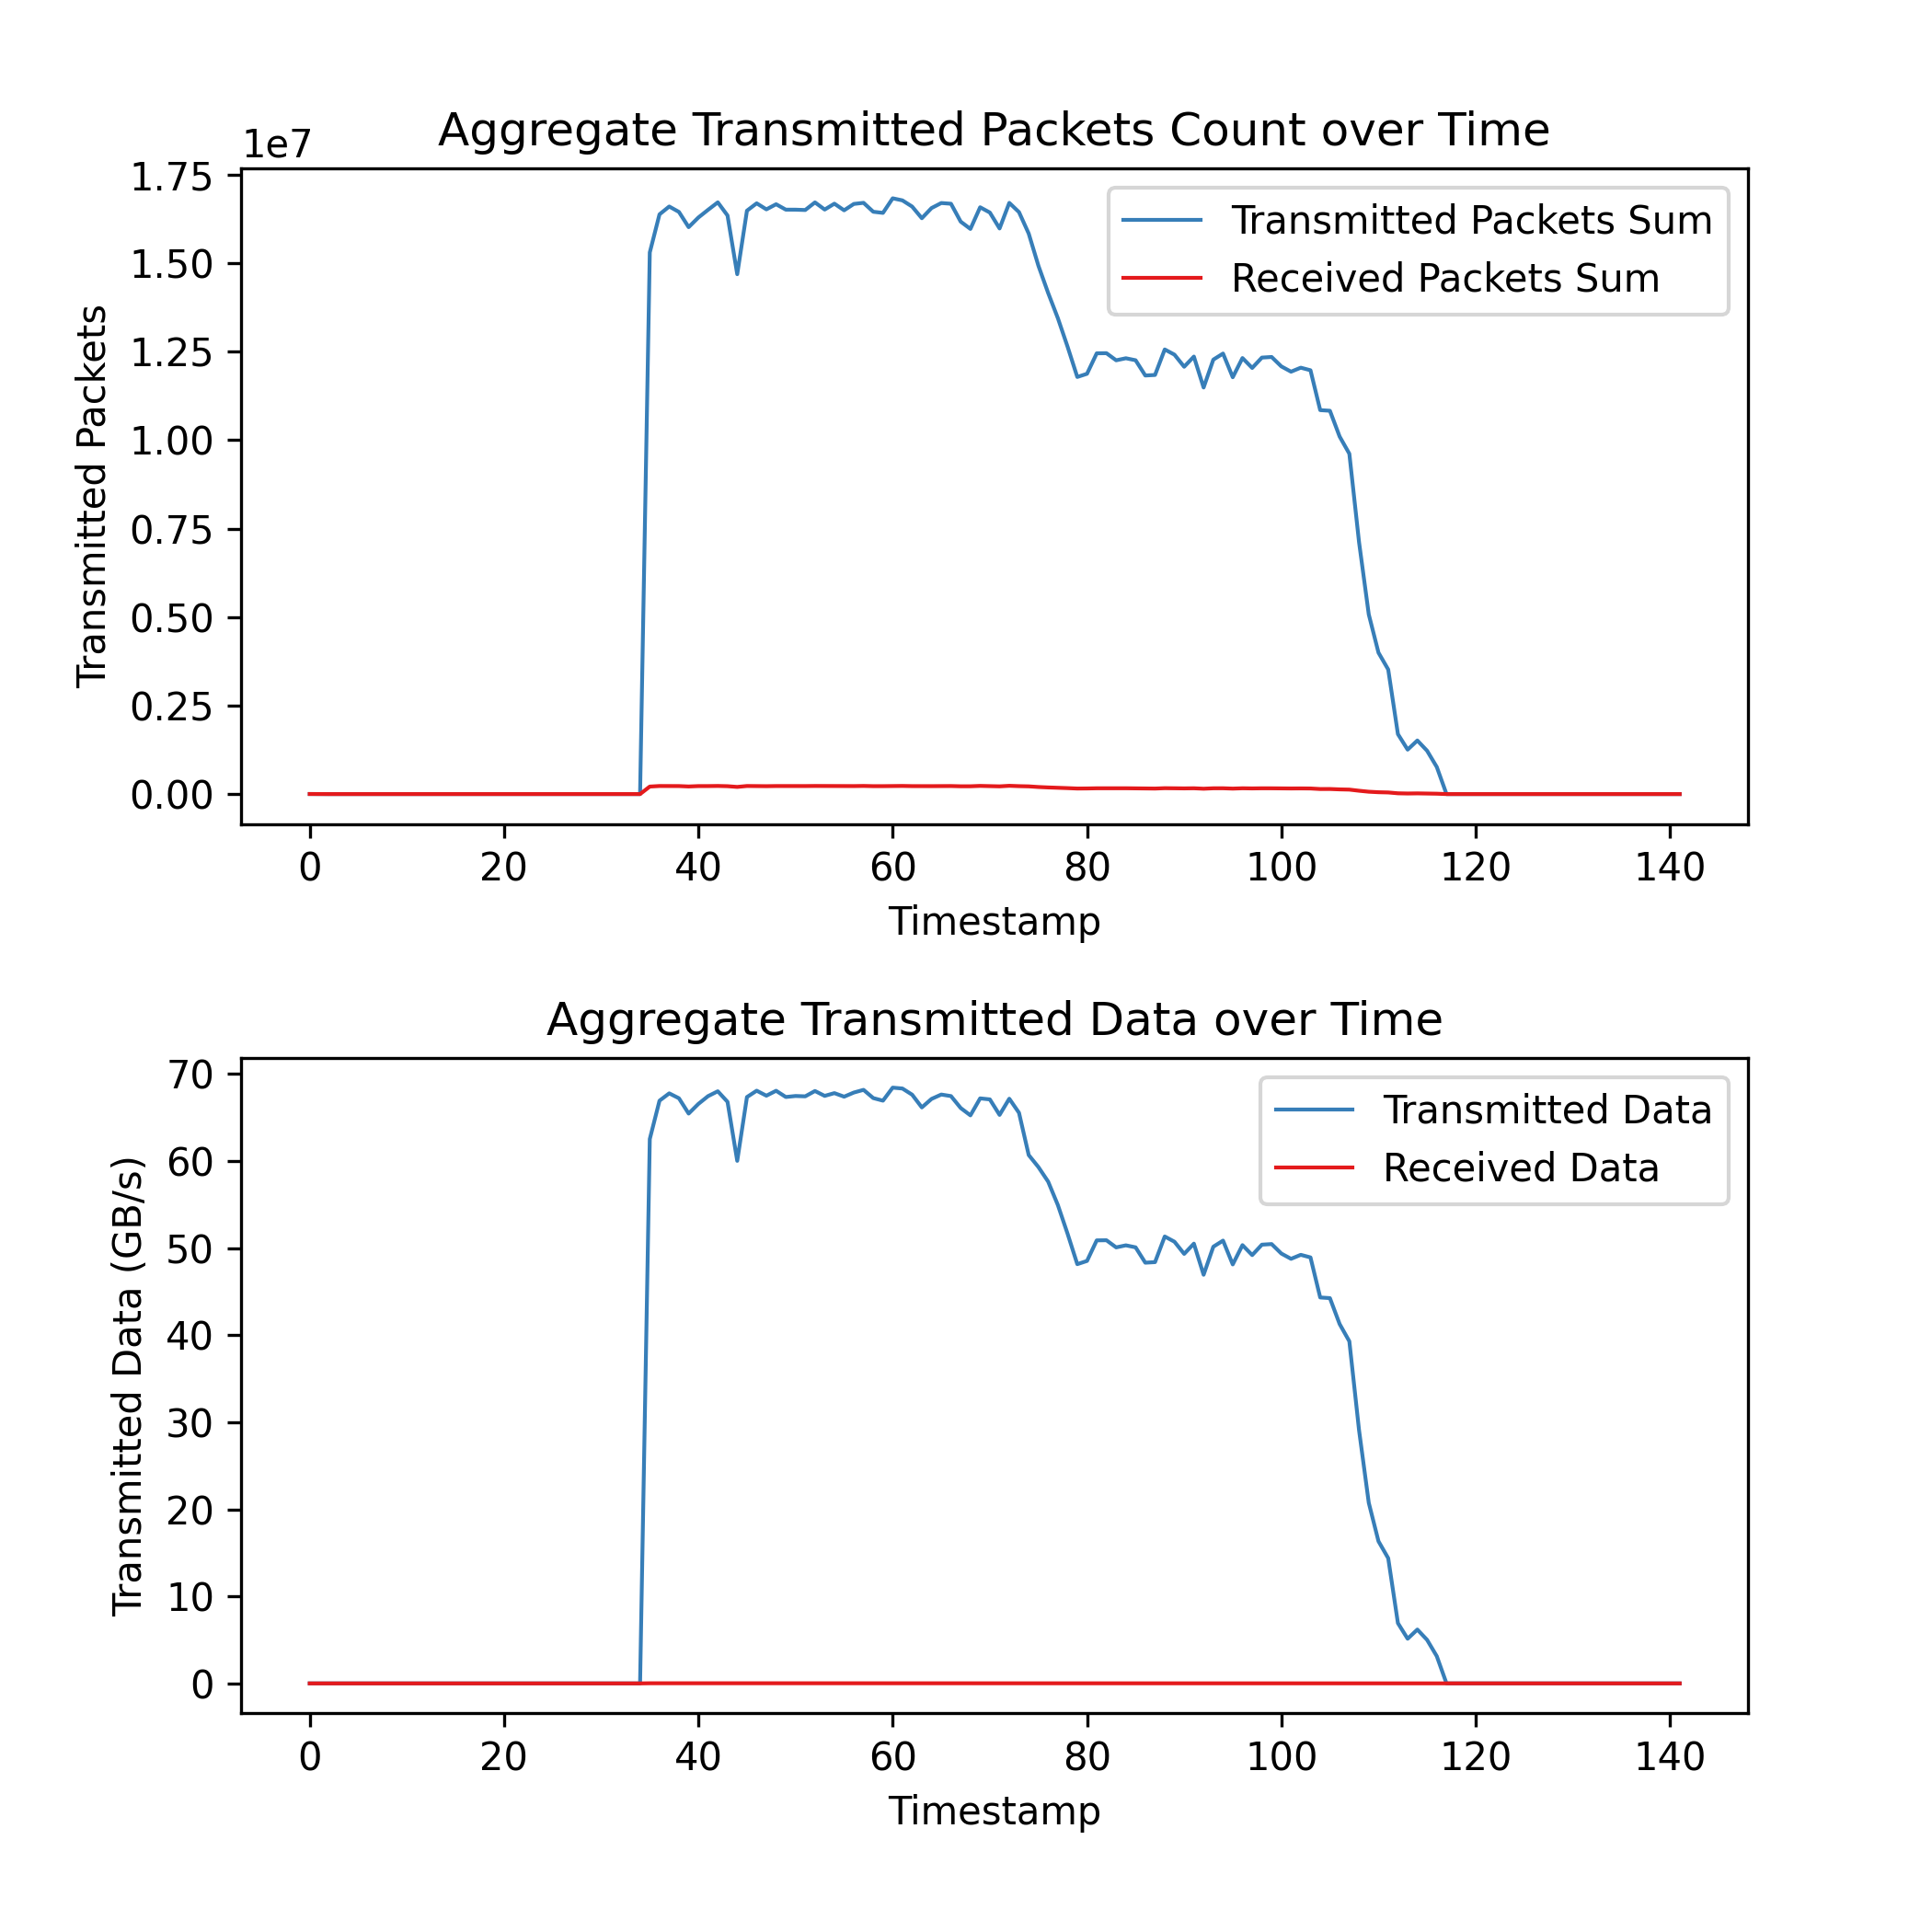
You can process/graph this file however you like (Microsoft Excel, Matplotlib, etc). Personally, I like to use a Jupyter Notebook to plot these results. You can see an example here:
Omniscient
ibmon.sh sits in the omniscient repo, which is a set of utility scripts and a CLI for monitoring a cluster in a distributed fashion.
This is easier than using the individual ibmon.sh and aggregate.py scripts directly; everything is handled for you by your omni configuration settings.
View the Omniscient documentation below for how to use this tool.